
A bottom in a stock is when it has hit the low price of its current downtrend and is in the beginning stages of a reversal higher. Delphian finds bottoming stocks that have met our aggressive bottom target (State 8, Target 3) and have crossed above an RSI level of 30. Backtesting revealed this signal is triggered near the bottom and the stock will begin the trend higher in the near future.
Trade Theory:
State 8 in State Modeling™ is the most bearish state and typically has large downward moves over an extended period of time. Once the State Modeling State 8, target 3 has been hit, the stock has hit Delphian’s most aggressive target price. The target 3 price is a potential support area with a possible reversal ahead. Using a secondary confirmation can assist in solidifying a potential price support and reversal. When Relative Strength Index (RSI) has bottomed out at a low and is increasing, buyers typically come into the market. When the 14-day RSI crosses above 30, the signal presents a buying opportunity. The combination of these two signals presents a potential bottom with a typically gradual rise over time.
The RSI Bottom study uses the following signals:
Charts depicting the confirmation of a bottom:
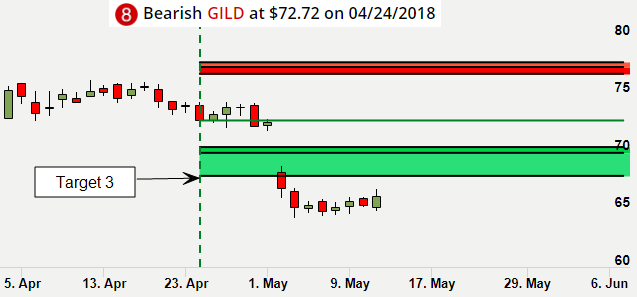
GILD State Modeling – State 8, Target 3 met on 05/02/2018
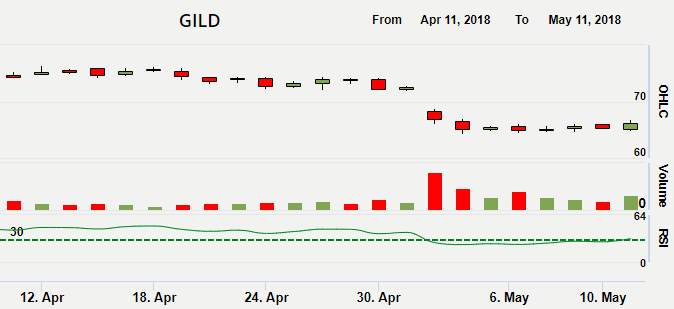
GILD RSI Crossed above 30 on 5/11/2018
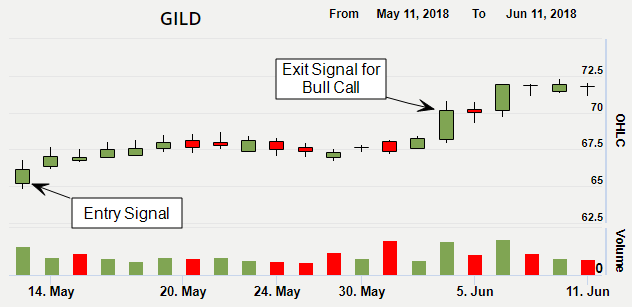
GILD chart after the bullish signal on 5/11/2018
Trade results after buy signal:
Bull Call with 25% profit and 100% stop loss
Entry 05/11/2018, 37.27% profit achieved on 06/04/2018 (In trade 16 trading days)
Bull Put with profit target of 80% max profit and stop loss of 50% of max risk
Entry 05/11/2018, 84.31% of max profit achieved on 06/04/2018 (In trade 16 trading days)
For additional option strategy results, please fill form on the right side of the page. One of Trading Strategists will reach out to you.
Explanation of the Signals:
1. The Relative Strength Index (RSI) is a momentum oscillator that measures the speed and change of price movements. The RSI oscillates between 0 and 100. The standard default for days is 14. Traditionally, the RSI is considered overbought when above 70 and oversold when below 30.
2. State Modeling™ is a proprietary signal from Delphian Trading. Stocks are in a State numbered from 1 to 8 at any given time and only in one state at a time. States 1, 3, 5 and 7 are bullish and States 2, 4, 6 and 8 are bearish. State 1 is extremely bullish while State 8 is extremely bearish. This signal allows users to find symbols based on their current state and whether or not their current targets or stops losses have been met.