
Signals to Buying Stocks on a pullback but correlated to move higher.
Signals used to generate the buy signal: 5-year Correlation to SPX and State Modeling™
Explanation of the signals:
State Modeling™ is a proprietary signal from Delphian Trading. Stocks are in a State numbered from 1 to 8 at any given time and only in one state at a time. States 1, 3, 5 and 7 are bullish and States 2, 4, 6 and 8 are bearish. State 1 is extremely bullish while State 8 is extremely bearish. This signal allows users to find symbols based on their current state, current state profit and loss targets and whether or not their current targets or stops losses have been met.
S&P 500, SPX, 5-year correlation is a measure to determine how correlated symbols are to the S&P 500 over a five year period. Correlation is measured from -1 to 1, with -1 being inversely correlated and 1 being perfectly correlated. Inversely correlated symbols move in the opposite direction of each other and correlated symbols move in the same direction. Therefore, if a symbol is highly correlated to the S&P 500 and the S&P 500 is moving higher than the correlated symbol should move higher as well.
Trade Theory:
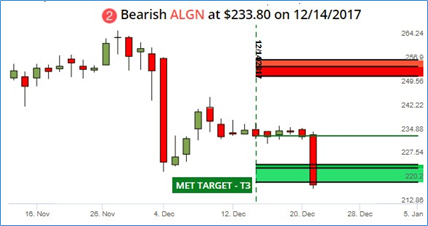
Most often when a stock transitions from State 1 to State 2, the stock is in a temporary pullback. Once the State Modeling State 2, target 3 has been hit, the stock has hit Delphian’s most aggressive target price. The target 3 price is a potential support area with a possible reversal ahead. Therefore, the stock should continue its original trend higher. Using a secondary confirmation can assist in solidifying a potential price support and the continuation of an uptrend. Correlation with the S&P 500 offers trend analysis that suggests when the S&P 500 is on an uptrend, stocks highly correlated with the index should continue an uptrend as well. The combination of these two signals presents a potential near-term bottom with a typically rapid reversal.
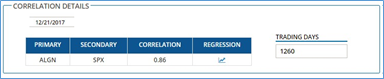
The 5 Year Correlation to SPX Pullback uses a correlation greater than or equal to 85% to the SPX over 5 years (1260 trading days) and the State Modeling™, State 2, target 3 met as a pullback and a reversal pending in the price.
Charts depicting confirmation of a pullback:
ALGN State Modeling – State 2, Target 3 hit on 12/21/2017
ALGN and SPX .86 correlated for 1260 trading days on 12/21/2017
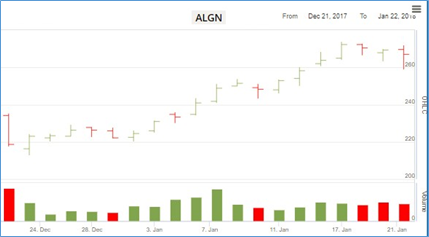
ALGN chart after the bullish signal on 12/21/2017
Trade results after buy signal:
Long stock with 5% profit and 10% stop loss
Entry 12/21/2017, 5.69% profit achieved on 01/03/2018 (In trade 8 trading days)
Long call with 25% profit and 100% stop loss
Entry 12/21/2017, 28% profit achieved on 12/27/2017 (In trade 4 trading days)
For additional option strategy results, please register on the right side of the page.