
Identifying a Pullback in stock prices using Keltner Channels and State ModelingTM
Signals used to generate the buy signal: Keltner Channels and State Modeling
Explanation of the signals:
Keltner Channels are volatility-based lines set above and below an EMA (exponential moving average). Keltner Channels are similar to Bollinger Bands, but Keltner Channels use ATR (average true range) to set the distance between the lines, whereas Bollinger Bands, use Standard Deviation.
State Modeling™ is a proprietary signal from Delphian Trading. Stocks are in a state numbered from 1 to 8 at any given time and only in one state at a time. States 1, 3, 5 and 7 are bullish and States 2, 4, 6 and 8 are bearish. State 1 is extremely bullish while State 8 is extremely bearish. This signal allows users to find symbols based on their current state, current state profit and loss targets and whether or not their current targets or stops losses have been met.
Trade Theory:
Often times when a stock transitions from State 1 to State 2, the stock is in a temporary pullback. Once the State Modeling State 2, target 2 has been hit, the stock has a high potential for a reversal. The target 3 price provides a support area and the stock should continue its original trend higher. Using a secondary confirmation can assist in solidifying a potential price support and the continuation of an uptrend. When the stock price drops below the lower Keltner Channel, prices are oversold and have a high probability of retracing. The combination of these two signals presents a potential near- term bottom with a typically rapid reversal.
The Keltner Pullback study uses the Keltner Channels set at 2 times Average True Range (ATR) for 20 days and the State Modeling™, State 2, target 2 met as a pullback and a reversal pending in the price.
Charts depicting confirmation of a pullback:
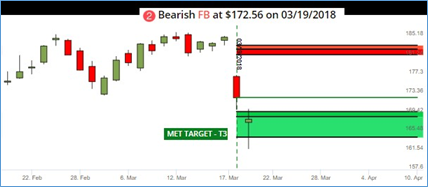
FB State Modeling – State 2, Target 2 hit on 3/20/2018
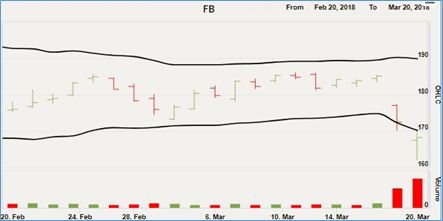
FB closing price crossed below Keltner Channels 2 ATR for 20 days on 3/20/2018
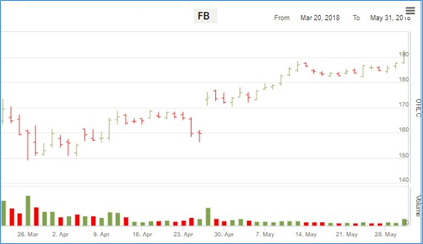
FB chart after the bullish signal on 3/20/2018
Trade results after buy signal:
Long stock with 5% profit and 10% stop loss
Entry 03/20/2018, 5.03% profit achieved on 05/04/2018 (In trade 33 trading days)
Long call with 25% profit and 100% stop loss
Entry 03/20/2018, 47.45% profit achieved on 05/10/2018 (In trade 37 trading days)
For additional option strategy results and detailed discussion with one of Options Strategists, please fill out the form on the right side of the page.