
10% drop in 10 days with State ModelingTM Pullback
Stocks can get buying support after quick drops and the trader’s entry price is relatively discounted.
Signals used to generate the buy signal: A 10% to 25% price drop within 10 days and State Modeling™
Explanation of the signals:
Price change between -10% to -25% over the past 10 days is a signal that displays stocks that have experienced a significant drop in price over a short period of time.
State Modeling™ is a proprietary signal from Delphian Trading. Stocks are in a State numbered from 1 to 8 at any given time and only in one state at a time. States 1, 3, 5 and 7 are bullish and States 2, 4, 6 and 8 are bearish. State 1 is extremely bullish while State 8 is extremely bearish. This signal allows users to find symbols based on their current state, current state profit and loss targets and whether or not their current targets or stops losses have been met.
Trade Theory:
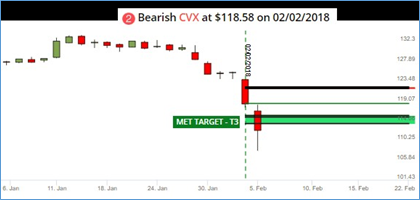
Most often when a stock transitions from State 1 to State 2, the stock is in a temporary pull back. Once the State Modeling State 2, target 1 has been hit, the stock has a high potential for a reversal. The target 3 price provides a support area and the stock should continue its original trend higher. Using a secondary confirmation can assist in solidifying a potential price support and the continuation of an uptrend. Price drops over a short period of time can be seen as an over-reaction to news or some external market event. Drops that happen suddenly are usually tested by reversals. If the stock has experienced a significant drop over a short period and hit the State 2 targets, then there is potential price support and a probable reversal coming in the near future.
The 10% Drop in 10 Days study uses a price drop from 10-25% over a 10-day period and the State Modeling™, State 2, target 1 met as a pullback and a reversal pending in the price.
Charts depicting confirmation of a pullback:
CVX State Modeling – State 2, Target 1 hit on 2/5/2018
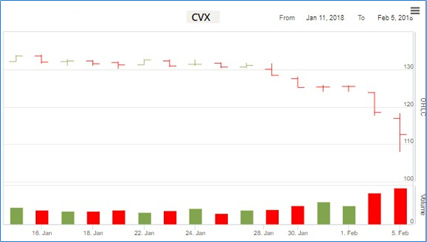
CVX 10% drop within 10 days
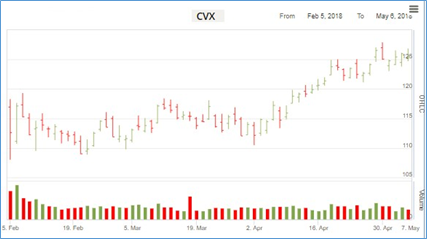
CVX chart after the bullish signal on 2/5/2018
Trade results after buy signal:
Long stock with 5% profit and 10% stop loss
Entry 02/05/2018, 5.53% profit achieved on 04/10/2018 (In trade 45 trading days)
Long call with 25% profit and 100% stop loss
Entry 02/05/2018, 76.19% profit achieved on 02/06/2018 (In trade 2 trading days)
For additional option strategy results, please fill form on the right side of the page. One of Trading Strategists will reach out to you.