
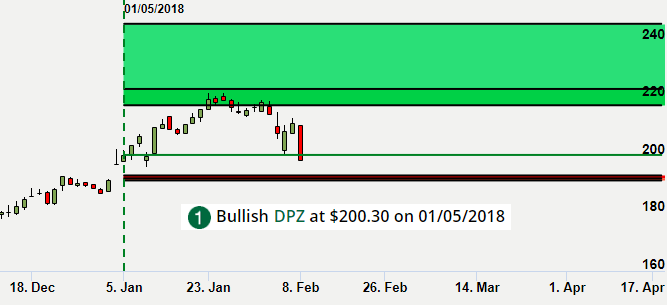
A pullback is a small to moderate drop in a stock price from recent peaks that occurs during an uptrend. Delphian finds stocks in pullbacks that have met one of our aggressive pullback targets (State 4, Target 2) and have a high correlation to the S&P 500 over a one year period. Backtesting revealed this signal occurs near the end of the pullback and to expect the stock to resume the trend higher soon after.
Trade Theory:
Most often when a stock transitions from State 1 to State 2, the stock is in a temporary pullback. Sometimes the stock will continue the downtrend into State 4. Once the State Modeling State 4, target 2 has been hit, the stock has hit one of Delphian’s most aggressive target price for the pullback. The target 2 price is a strong support area and bullish stocks will usually have a reversal at that support level and continue its original trend higher. Using a secondary confirmation can assist in solidifying a potential price support and the continuation of an uptrend. Correlation with the S&P 500 offers trend analysis that suggests when the S&P 500 is on an uptrend, stocks highly correlated with the index should continue an uptrend as well. The combination of these two signals presents a potential near-term bottom with a typically rapid reversal.
The 1 Year Correlation to SPX Pullback uses the following signals:
Charts depicting confirmation of a pullback:
DPZ State Modeling – Current State is State 1 on 2/8/2018
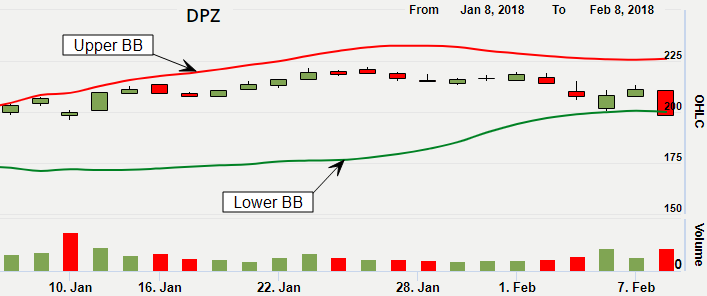
DPZ closing price crossed below Bollinger Bands 2.5 SD for 20 days on 2/8/2018
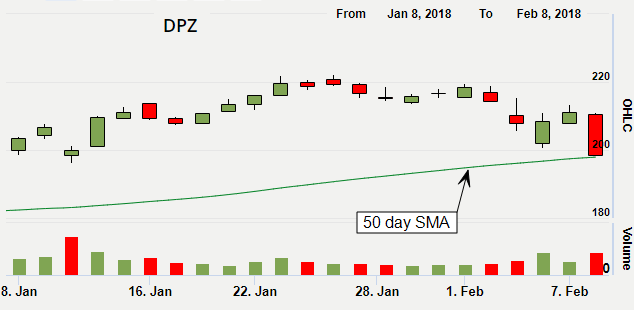
DPZ closing price is above the 50 days SMA on 2/8/2018
DPZ chart after the bullish signal on 2/8/2018
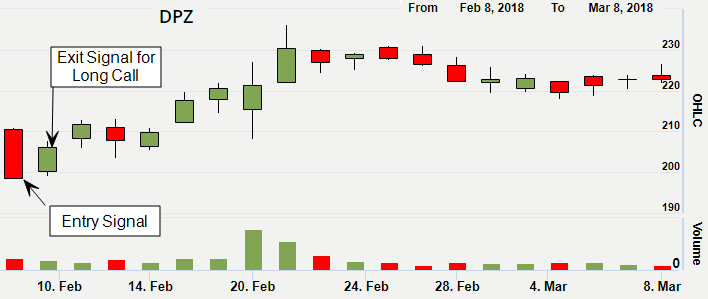
Trade results after buy signal:
Long stock with 5% profit and 10% stop loss
Entry 02/08/2018, 6.7% profit achieved on 02/12/2018 (In trade 3 trading days)
Long call with 25% profit and 100% stop loss
Entry 02/08/2018, 36.53% profit achieved on 02/09/2018 (In trade 2 trading days)
For additional option strategy results, please fill form on the right side of the page. One of Trading Strategists will reach out to you.
Explanation of the signals: