
A deep pullback is a moderate to large drop in a stock price from recent peaks that occurs during an uptrend. Delphian find stocks in deep pullbacks that have met our conservative deep pullback target (State 4, Target 1) and have crossed below the lower Keltner Channel. Backtesting revealed this signal is triggered near the end of the deep pullback and to expect the stock to resume the trend higher soon after.
Trade Theory:
When a bullish stock transitions from State 2 to State 4 the down move is seen as an overextended pullback. Once the State Modeling State 4, target 1 has been hit, the stock has a high potential for a reversal. The target 3 price provides a support area and the stock should reverse to its original trend higher. Using a secondary confirmation can assist in solidifying a potential price support and the continuation of an uptrend. When the stock price drops below the lower Keltner Channel, prices are typically near a bottom and have a high probability of retracing. The combination of these two signals presents a deep price pullback and an excellent bullish entry point.
The Keltner Deep Pullback study uses the following signals:
Charts depicting confirmation of a deep pullback:
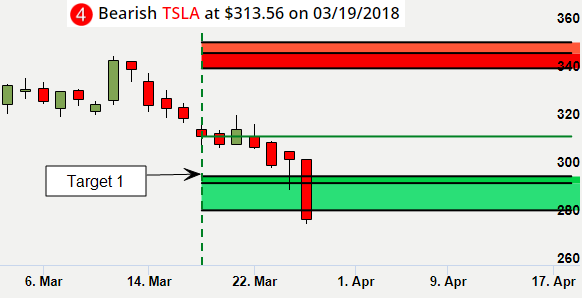
TSLA State Modeling – State 4, Target 1 hit on 3/26/2018
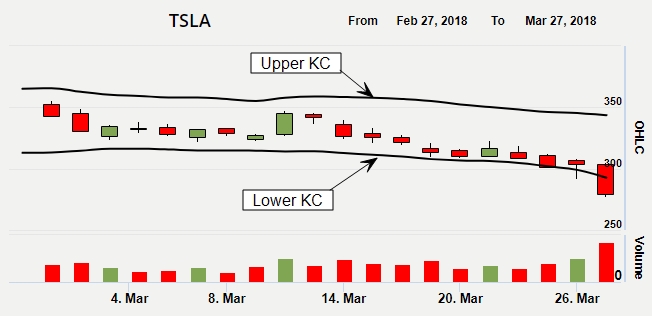
TSLA closing price crossed below Keltner Channels 2 ATR for 20 days on 3/27/2018
TSLA chart after the bullish signal on 3/27/2018
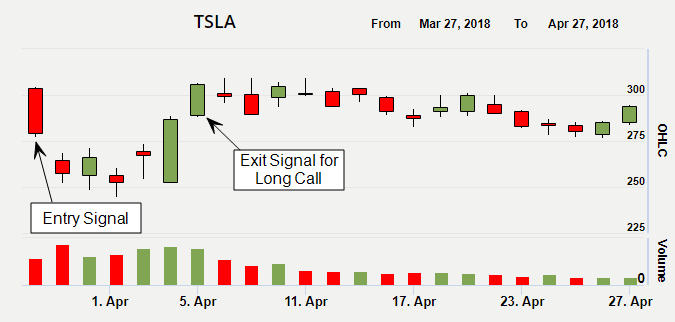
Trade results after buy signal:
Long stock with 5% profit and 10% stop loss
Entry 03/27/2018, 9.51% profit achieved on 04/05/2018 (In trade 7 trading days)
Long call with 25% profit and 100% stop loss
Entry 03/27/2018, 78.62% profit achieved on 04/05/2018 (In trade 7 trading days)
For additional option strategy results and detailed discussion with one of Options Strategists, please fill out the form on the right side of the page.
Explanation of the signals:
1. Keltner Channels (KC) are volatility-based lines set above and below an EMA (exponential moving average). Keltner Channels are similar to Bollinger Bands, but Keltner Channels use ATR (average true range) to set the distance between the lines, whereas Bollinger Bands use standard deviation.
2. Average True Range (ATR) is a stock's range between the high and low price on any given day. It reveals information about how volatile a stock is. Large ranges indicate high volatility and small ranges indicate low volatility.
3. Exponential Moving Average (EMA) is a type of moving average that is similar to a simple moving average, except that the most recent data gets the greatest weight and each price value gets a smaller weight as we go back in the series chronologically.
4. State Modeling™ is a proprietary signal from Delphian Trading. Stocks are in a state numbered from 1 to 8 at any given time and only in one state at a time. States 1, 3, 5 and 7 are bullish and States 2, 4, 6 and 8 are bearish. State 1 is extremely bullish while State 8 is extremely bearish. This signal allows users to find symbols based on their current state, current state profit and loss targets and whether or not their current targets or stops losses have been met.